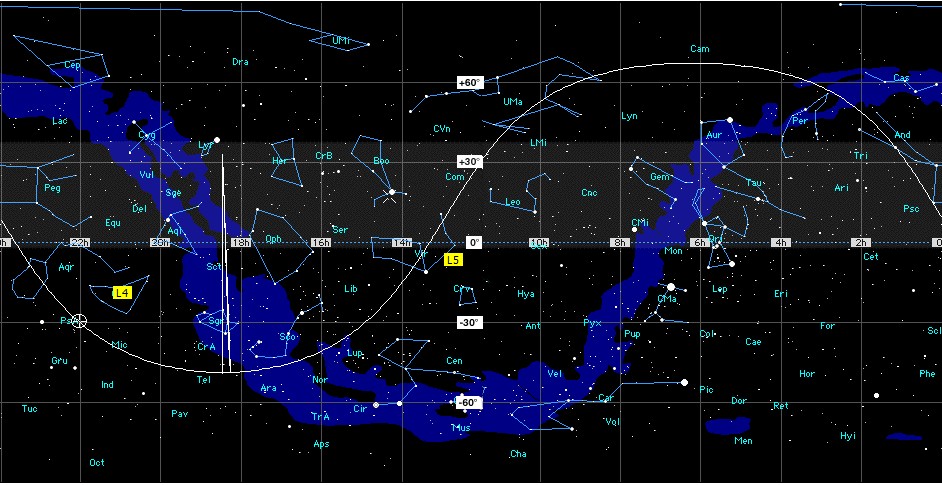
Current view of the sky over the current SETI Net station. Click for a full size view...
The blue band is the milky way. The 'X' is the star location being searched. The 'O' is the antenna position. The size of the 'O' is the beam width. When the 'x' and 'O' overlap the antenna is locked and tracking. L4 and L5 are shown.
The Sine Wave is the minimum El of the antenna. The spike is the mechanical stop on Azimuth.

This is the current operating status of the station. This is updated every minute during normal operation. Click to enter the home page.
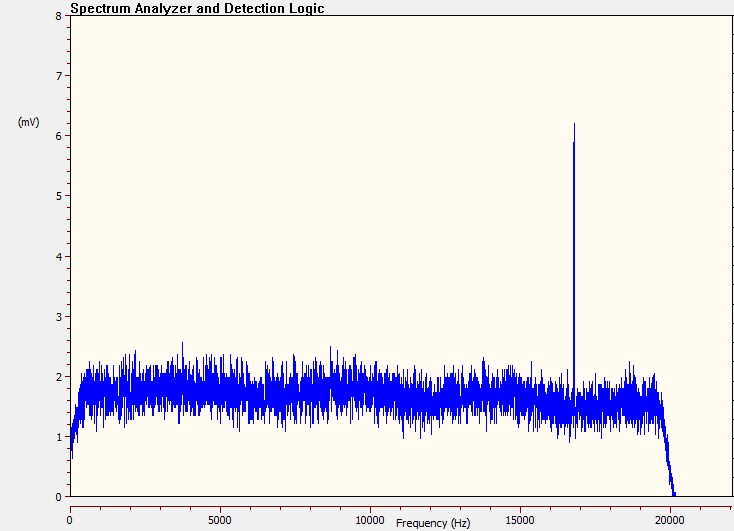
Click to see a current Spectrum Analyzer snapshot. The vertical scale is amplitude in mVolts audio. The horizontal scale is frequency. A peak15% higher than the average of its 10 neighbor bins will trigger the alarm and start recording .
The upper, Red, spectrum (if shown)is the maximum level tested for signals. Anything above this arbitrary level is ignored.

All art by : Stephan Martiniere