V3 Chapter 21
101. Spectrum Analyzer ( 2006-10-03 to Present )
I have the SpecAna running well enough to release now. I actual use a much larger set of blackbody values than shown in item 100 below and I have a Rainbow color scheme as well.
The analyzer seems to work well and I have included a AutoSave feature that generates file names, base on the computer clock, and automatically stores them away as you work. The Audio portion is saved as WAV files, the waterfall as a series of jpg files. Both types of files are automatically tagged with SML data.
Now I can move to the integration of all the components
100. Spectrum Analyzer ( 2006-09-13 to 2006-10-03 )
I'm working on the Waterfall display portion of the SpecAna now. One of the problems that must be solved is just how to write to pixels on the display. I would like to have a waterfall that reflected the FFT output in a bin/pixel manor so that when the FFT is producing 2048 bins per scan the the waterfall would be 2048 pixels wide.
I found a good way to do this once and then lost the link. Today I found it again so this time I'll put the link here to remember it:
Color science is a complex discipline that I (luckily) only need to understand a bit of. One of the major decision points was just how to display the waterfall values. I want a display that represents the amplitude of the signal as a smooth transition from lower signal values to full scale. I would like to have black minimum and white maximum. The best thing I have found is the color scale for a blackbody which is a smooth transition for red at 1,000 deg K to blue at 29,800 K.
I have decided to use a direct table lookup for the color values of the FFT waterfall. After much thrashing around I came to Mitchell Charity's web page where he presents the table (below) this shows the color for a blackbody at a certain temperature. It also shows the RGB values that produce the color on you screen. For example the color for 1000 degrees K is #FF3800. This hex value can be broken down to Red = FF hex (256 decimal), Green = 38(56), Blue = 00(00). Using this table I can lookup the RGB values for the waterfall rather than computing them on the fly.
What color is a blackbody?
Some pixel RGB values from Mitchell Charity on his fine web site
99. Antenna Fixed ( 2006-09-10 to 2006-09-13 )
After much thrashing around I ordered and received a new set of H-Bridges from Digi Key and installed one on one of the older Kerr modules. This got the PWM reverse sorted out. Then the Az pulse counter seemed to stop working then started again. I think this was (and still is) a loose connection somewhere in the cable between the control box and the rotor. I guess I'll have to keep an eye on it but it all works now.
98. Antenna ( 2006-09-01 to 2006-09-10 )
I got sidetracked on an antenna problem for a bit. The Kerr Azimuth control module blew out the H-Bridge IC that controls the motor and needed to be replaced. In the process I realized that I didn't have a replacement IC and had to order more but I put one of the new versions of the Kerr modules on line. For some reason the new version will not run PWM in reverse. When ever I set the REVERSE bit in the mode command nothing happens.
I am tempted to rewrite the antenna control software from scratch because its looking kind of dated now.
97. System Control ( 2006-08-29 to 2006-08-31 )
I have fixed the SpecAna so that it records correctly and now have started the development of the System Controller (shown as 'Controller' in the figure below). I thrashed about for a day looking for a way to build an application that is controlled by clicking on icons. I wanted to automate the picture below but I think I found a better way. I'm going to use a series of thumbnails that when clicked open the underlying application. This is one:
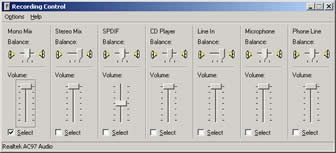
Recording Control
This way when I click on the thumbnail the real application will start and be placed into the data stream.
96. Thinking Out Loud ( 2006-08-25 to 2006-08-28 )
I now have a SpecAna that works well but only in 44.1 sample rate, 16 bit, mono mode. Should I put some more work into it?
I could make it more versatile but the real reason for the device is as a front end for the Waterfall display. I have found an Active X component from Guangming Software and its not very expensive ($100) but do I need it? It would allow me to create different files than the WAV format I now use, on the fly, but is that important? I could still create WAV files, tag them with SML and convert them to one of the lossless codex (WMA, OGG, FLAC or any of the others) after the fact in batch mode. The OCX does allow me to set the volume and channel but I do know how to do that directly. I has a 'silence' detector that would act as a squelch but since I don't expect SETI data to every be completely quite this wouldn't be much help.
I also have a full function SpecAna (from Virtins) if I need it for a development tool so why would I build anything other than a very specialized device?
I think I just talked my self into it. I'm going to release this version As Is and go on to the Waterfall.
With that bit of decision out of the way this is how it will shape up.
95. Vertical Calibration( 2006-08-24 to 2006-08-25 )
I couldn't find one of the HP true RMS AC voltmeters like the one that I blew up but I did find an HP 350D Attenuator Set that worked out fine.
Using this as a transfer standard I was able to verify the front end attenuator settings in the software. I ran the SETI Net Tone Generator on the RemoteSETI computer and connected that Sound Card line out to the HP 350D. The Tone Generator was running a 10 KHz sine wave. The output of the HP went to the interface box that I had previously constructed (with the limiting diodes). I could then simply turn on or off either Spectrum Analyzer for the test.
The results followed what was expected closely.
| HP 350D Setting | SETI Net SpecAna Display | Scale | Attenuator | Calculated dB |
| 0 | 300 mV | 512 mV | 8192 | 0 |
| 10 | 121 mV | 512 mV | 8192 | -10 |
| 20 | 37 mV | 64 mV | 128 | -10.2 |
| 30 | 12 mV | 64 mV | 128 | -9.7 |
| 40 | 3.8 mV | 16 mV | 128 | -9.9 |
| 50 | 1.19 mV | 3 mV | 128 | -10.15 |
| 60 | 400 uV | 512 uV | 64 | -9.46 |
| 70 | 140 uV | 256 uV | 32 | -9.1 |
| 80 | 50 - 60 uV | 128 uV | 16 | -8.9 to -7.3 |
Notes:
- The HP Setting are in dB inserted in line
- The SpecAna Display values were taken by eye
- The Scale is the full scale setting on the SpecAna
- The Attenuator is a simple DIV instruction applied to each incoming data point before the FFT
Begin
SP := Pointer(Buffer);
For i := 1 To FFT.SpectrumSize Do
Begin
v := SP^;
Inc(SP);
FFT.RealSpec[i] := v Div InputAttenuator;
End;
End;
5. Calculated dB is the voltage form
dB = 20 log ( E previous/ E this)
Down at the bottom end things got very noisy and the signal fell down to the grass. The Virtins SpecAna quit triggering when -30 dB was inserted (about 35 mV). I have no idea why. The SETI Net SpecAna triggers automatically with or without signal.
With this running right I can go back and figure out the 8 bit version
94. Comparison( 2006-08-23 to 2006-08-23 )
This is a comparison between the Virtins SpecAna and my own.
.
1024 FFT Size
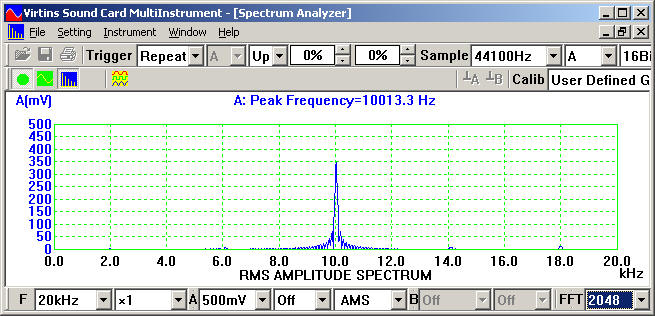
2048 FFT Size
These two screen grabs are from the Virtins Spectrum Analyzer with a 10 kHz signal. The only difference between the two is the FFT size. The top screen is with a FFT.SpectrumSize of 1024, the bottom at 4096. This SpecAna presents RMS Amplitude and so:
FFT resolution = Sample Rate / FFT Size
The larger number of bins causes each bin to be shorter and therefore contain less energy to be displayed

1024 FFT Size
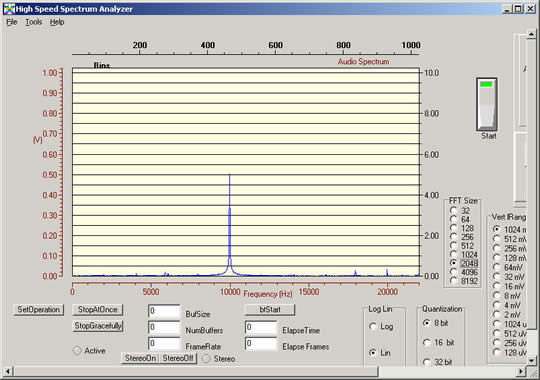
2048 FFT Size
My ( very rough) SpecAna shows the same thing except that instead of 500 mV and 350 mV mine shows 650 mV and 500 mV.
Why the large difference is unclear to me. I don't have an RMS voltmeter that can measure down to these levels but I might be able to buy a surpluses one today. With that I might be able to understand what is going on better.
93. Spectrum Analyzer Quantization ( 2006-08-22 to 2006-08-24)
I have the vertical scales sorted out now. I used a combination of input range attenuation and adjustment of the vertical scale on the display. It works fine in 16 bit mono but now I would like to get it to work in 8 bit mode. That changes everything around again but at least I'm making progress.
92. Spectrum Analyzer Scale Calibration ( 2006-08-19 to 2006-08-22 )
I have a rough version of the SpecAna up and running now.
Thumbnail for larger pix
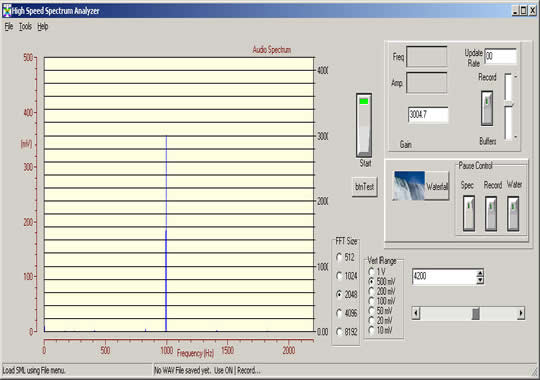
One of the major stumbling block has been my understanding of the scales used and how they relate to the FFT spectrum size. I have the horizontal scale worked out now so that you can switch spec. sizes and it figures out how to adjust the scale. The next thing will be the vertical axis. Here is the problem as I understand it:
- I'm using a sound card at 16 bit quantization. I use mono (not stereo) and a frame rate of 44100 samples/second.
- I limit the input to the sound card at 1 V P-to-P with diodes
- Adjusting the input to the card until Virtins Scope shows 0.7 V RMS (1 V P-to-P) causes the Virtins SpecAna to display a 450 mV signal at 10 kHz. Other In/Display values are shown in the table below.
| mRMS V In | Virtins SpecAna Display (mV) |
| 700 | 450 |
| 600 | 400 |
| 500 | 325 |
| 400 | 260 |
| 300 | 200 |
| 200 | 120 |
| 100 | 50 |
| 90 | 45 |
| 80 | 35 |
| 72 | 25 |
Seems linear enough
- Virtins quits triggering at 70 mV RMS. My SpecAna triggers all the way down to where I have to shut off the oscillator.
- I am displaying the power spectrum output of the FFT
Now I have to figure out how to scale the SETI Net SpecAna correctly.
91. Spectrum Analyzer Rebuild( 2006-08-13 to 2006-08-19 )
The High Speed Spectrum Analyzer was always a proof of concept piece of software and never did perform well. Part of the reason was that I didn't have access to a good instrument that I could 'borrow' features from. It was built using the By Guess and By Golly principal ('I guess I'll try that... Virtins< that makes use of the computer sound card for the A-to-D conversion and has a bunch of features that I can copy. So here is the specifications for the next generation SETI Net SpecAna:
- Single Channel - The audio will be directed from either the left channel or the right be there will be no dual channel display. Channel selection will be by radio button.
- Sample Rate - This will be fixed at 44,100 Hz, 16 bit.
- FFT size of 2048 bins - This will allow the waterfall to stretch across both my monitors running at 1280 X 1024 and be able to assign one bin per pixel. I have run the Virtins SpecAna over several FFT sizes and see no difference in processor load so 1024 looks good on the screen and works well with the resolution and it will be used. I will not have a selectable FFT size.
- X Scale - I will have a linear display with no option for log.
- Y Scale - I will have an absolute display in terms of volts. The maximum input to the sound card is +/- 1 V
- Range Y - I will have a multiplier for the Y axis of 1V, 500mv, 200mv,100mv, 50mv,20mv and 10mv. This will be a radio button selection. The range selection will determine the scale shown on the left side
- Grass Cutter - There will be a scroll bar on the left side that will bias the display up/down so that I can make the noise line disappear if I want
- Windowing - There will be a radio button selection of Rectangle (default), Triangle, Hanning, Hamming, or Blackmen
- The peak frequency will be calculated and displayed in Hz.
- Cross Hair - The mouse will move a cross and calculate the amplitude and frequency of its location
- Waterfall On/Off - A toggle will turn the waterfall on and start it or resume it if it has been running. The toggle will pause it when in the off position.
- Waterfall Width - The width will be selectable as: 2048, 1024,512 bins. If a dual monitor is not detected a horizontal scroll bar will appear that will allow the image to be moved left or right.
- Record On/Off - A toggle will start or pause the recording of a WAV file. The WAV file will be automatically saved periodically. The run time for each segment will be 5 minutes (TBD 10 meg of data). The user will be queried for a base file name to save. If no SML file was associated with this WAV file a minimum SML file will be attached with the parameters available at the time.. The first save action will be this file name with a '1' appended. This will be incremented for each auto-save.
- SML Select - An SML file will be able to be selected from a file dialog. The selected SML will be used to tag the saved WAV file with SETI Markup Language data.
- Clear File - A menu selection will allow the recorded WAV file to be cleared
